
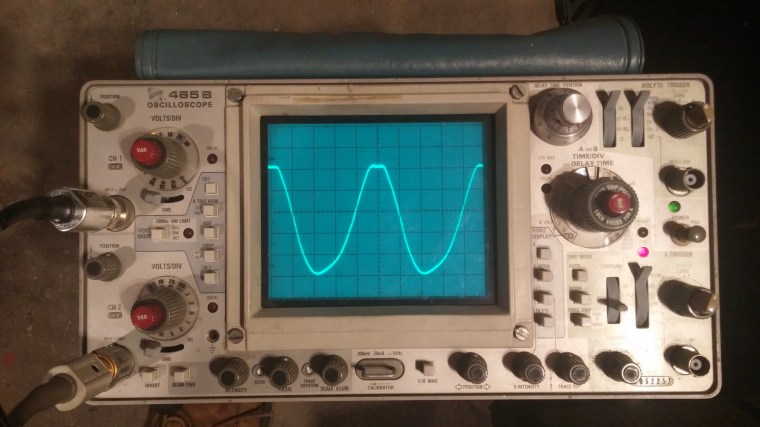
Pictured here is my oscilloscope displaying a 1khz waveform from my 50 watt amplifier. The waveform is noticeably clipped at the top, but just slightly. This was from my output power measurement test. If you’re only interested in the total, scroll to the end of the post. Otherwise, follow along with me.
My amplifier was set up with a 1khz sine wave into the input. The gain knob was increased until clipping, and backed off a bit. The volume knob was then increased until the output was just clipping. The output was driving a 16 ohm dummy load. I measured the voltage that my amplifier was driving across this load.
On screen, you can see the waveform measures 5 divisions high. If you look closely at the 1st input selector switch, it is set to 2 volts per division. The probe is a 10X probe, meaning that the voltage is actually 10X larger than shown on screen. That means this waveform measures 5*2*10 volts or 100 volts peak to peak.
To convert a value from volts peak to peak into volts rms, you must multiply by the square root of 2 (1.41) and divide by 4. This gives you a value of 35.35 volts rms.
At this point, I wanted to do a reality check against my oscilloscope, so I set the frequency of my test signal to 60hz and measured the volts rms with a handheld meter. Why 60hz? The handheld meter is designed for measuring household AC voltages at 60hz.
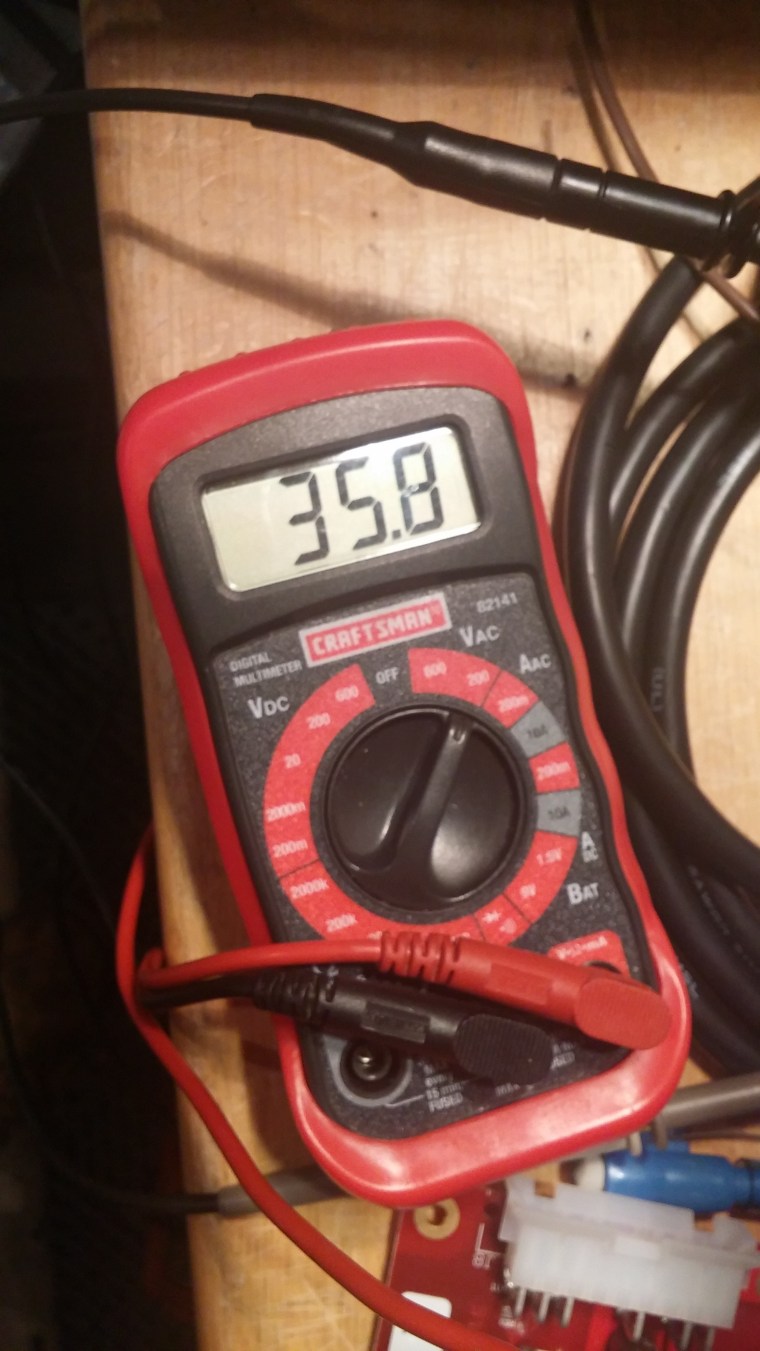
It measures a bit higher than my calculations. This is expected as the meter assumes a perfect sine wave free of any clipping. Nevertheless, it proves my calculations are in the same ballpark.
To convert volts rms into watts rms, you must square the voltage and divide by the load. This gives…
Before I reveal the answer, I want to address the doubts. Some will ask, “Why have the oscilloscope picture measure 1khz, and not 60hz?”. Because this is a fully analog oscilloscope, there was far too much flicker at 60hz to get a good picture. Plus, 1khz is a good high mid frequency where as 60hz is a bass guitar frequency.
“The signal is visibly clipped here. How can you call this ‘clean watts’?” I am measuring the lower peak to the upper peak. Lowering the volume slightly will eliminate the clipping, but wouldn’t change the measurement on the oscilloscope. It serves as a indication that we really are at the limit. It will change the handheld measurement a bit, but it will come to match the oscilloscope measurement when not clipped.
“What percentage T.H.D. are you measuring at?” I don’t know, but I also don’t care. This is a guitar amplifier, not hi-fi. Below this volume, there is no clipping. At and above this point, there is clipping. This is a very good indicator that the sound characteristics change at this power output. Hence, clean power! To go a little further, the fat lower portion of the waveform and the thin upper portion suggests significant 2nd order distortion while clean, imparting a fullness and sweetness to the tone. The clipping on the top peaks (before bottom peaks) indicate asymmetrical clipping (or even order distortion). Both of which are quite musical!
And now the moment you have all been waiting for…I measured an astounding…
78.125 clean watts!!!
All from a pair of 6L6s.

Leave a comment